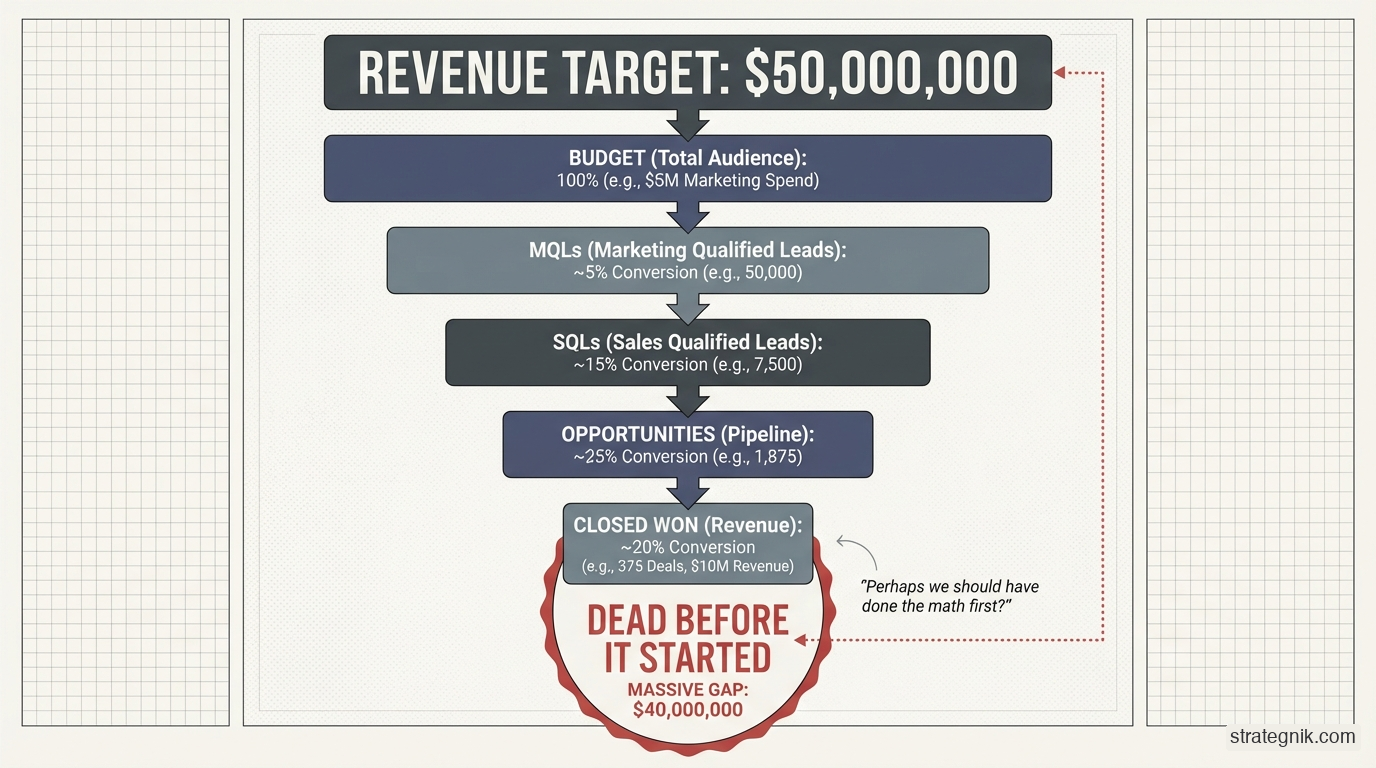
Most B2B revenue plans fail before a single campaign launches, because the funnel math is internally inconsistent. The revenue goal, the marketing budget, the conversion assumptions, and the sales cycle simply do not reconcile with each other. Nobody does the translation between “we want $3M in new ARR” and “here’s the volume, velocity, and conversion chain that has to hold for that to be reachable.” I built a free funnel velocity calculator to force that translation into the open.
Every new client engagement starts the same way. They hand me three numbers: a revenue goal, a time horizon, and a marketing budget. Sometimes there’s a fourth: a headcount assumption.
Then they look at me and ask: does this work?
I’ve been asked this question at least a dozen times across my career. And about nine of those times, before I said a word, I already knew the answer was no. Not because the goal was too ambitious. Not because the market wasn’t there. Because the math didn’t clear. The inputs were internally inconsistent in ways that no amount of good execution could fix.
The problem isn’t that founders and CROs set unrealistic goals. It’s that nobody has ever shown them the mechanism that connects their budget to their number: the actual chain of conversion, velocity, and volume that has to hold for the revenue target to be reachable. So they pick numbers that feel right and call it a plan.
I got tired of rebuilding that model from scratch every time. So I built a tool.
Why Is Bad Pipeline Math Invisible Until It’s Too Late?
Here’s how bad pipeline math usually plays out.
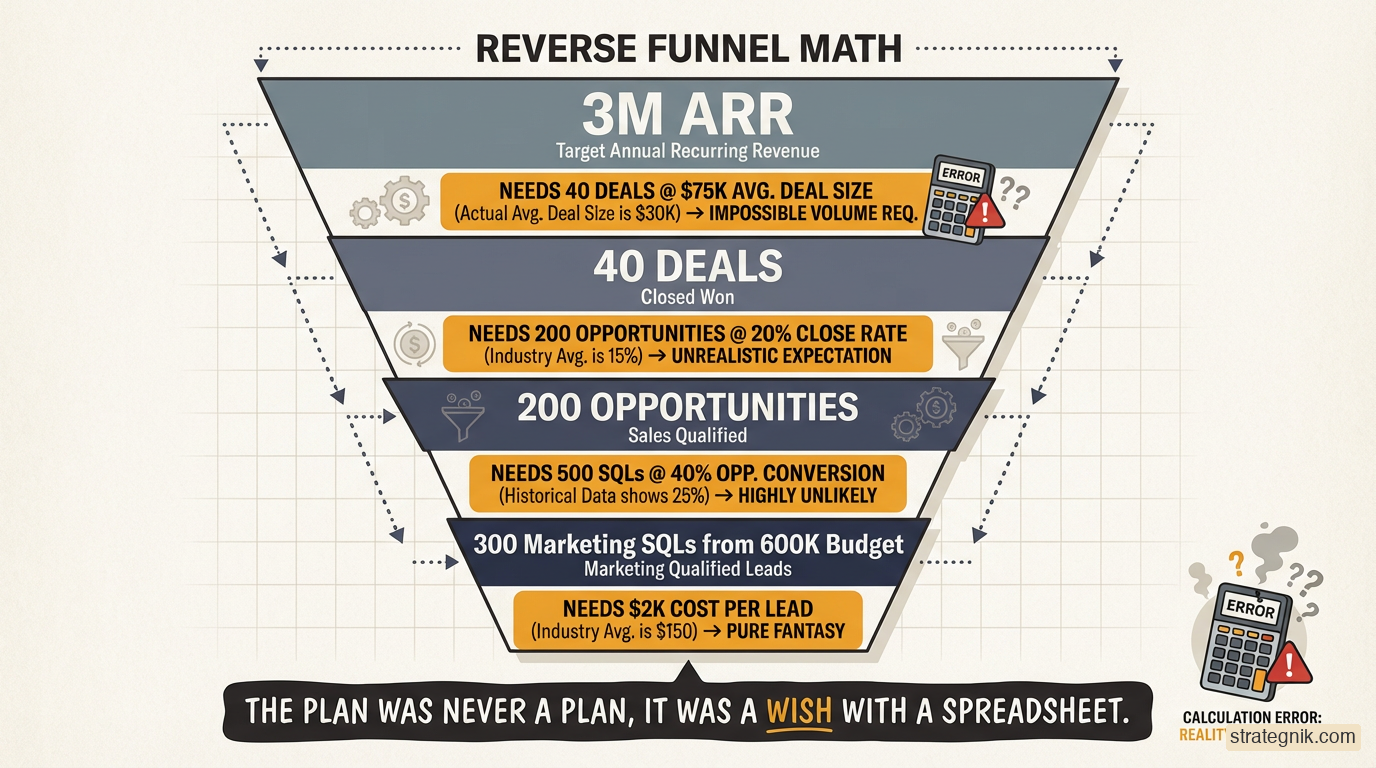
A company wants $3M in new ARR this year. They have $600K in marketing budget and a 90-day average sales cycle. Their close rate is around 20%, and their average contract is $75K.
Run the numbers and you need 40 closed deals. At 20% close, that’s 200 qualified opportunities. At a typical SQL-to-opportunity rate of 40%, that’s 500 SQLs. If marketing sources 60% of pipeline, you need 300 marketing-sourced SQLs — in a year, with a 90-day sales cycle, which means you’re really working with about three effective pipeline windows.
That’s 100 marketing-sourced SQLs per quarter. From a $600K budget. With no brand presence, no existing content engine, and a sales team that’s still figuring out the pitch.
The same reverse waterfall as a table:
| Stage | Assumption | Required volume |
|---|---|---|
| Revenue target | $3M new ARR | — |
| Closed deals | $75K average contract | 40 deals |
| Qualified opportunities | 20% close rate | 200 opportunities |
| SQLs | 40% SQL-to-opportunity | 500 SQLs |
| Marketing-sourced SQLs | Marketing owns 60% of pipeline | 300 SQLs |
| Per effective quarter | 90-day cycle, ~3 usable pipeline windows | ~100 SQLs/quarter |
Every row is a bet. The plan only works if all five bets pay off simultaneously, and most planning conversations never state a single one of them out loud.
Can it happen? Maybe, in a best-case scenario with everything going right. Is it the plan? No — the plan was “$3M ARR, $600K budget, let’s go.”
This is the gap I kept encountering: between the revenue goal that gets presented to the board and the funnel reality that has to exist for that goal to be reachable. Nobody was doing the translation. Or if they were, they were doing it in their head, trusting their gut, and moving on.
The problem with gut math is that it has no error bars. You can’t see where you’re optimistic. You can’t see what has to break for the model to fail. You can’t tell a founder “your budget isn’t wrong, your close rate assumption is,” because the close rate assumption was never made explicit.
How Do You Calculate Pipeline Coverage From Funnel Math?
Pipeline coverage is the ratio of open qualified pipeline to the revenue target it has to produce. The formula is simple: required coverage is the inverse of your win rate. If you close 20% of qualified pipeline, you need 5x coverage. Close 25% and you need 4x. The ratio isn’t a rule of thumb someone handed down; it falls directly out of your own conversion math.
Run it against the example above. The $3M target at a 20% close rate requires 200 opportunities at $75K each, which is $15M in qualified pipeline. That is 5x coverage, and it has to be timed coverage: pipeline that can actually close inside the planning year given a 90-day cycle. Pipeline created in November is next year’s coverage wearing this year’s jersey.
This is where most coverage conversations go wrong. Teams quote a coverage number without asking two questions first. One: is the win rate behind the ratio an empirical number or a hope? A 5x target built on an assumed 20% close rate is worthless if the real rate is 12%; the true requirement is 8.3x and nobody knows it. Two: is the coverage aged correctly? Gross pipeline that includes stalled deals from two quarters ago inflates the ratio without improving the forecast. What the right ratio looks like also depends on stage and motion, which is why I keep stage-appropriate GTM metrics as a separate discipline from the funnel model itself, and why I publish benchmark ranges for B2B GTM metrics rather than single “correct” numbers.
Coverage is the output of funnel math, not a substitute for it. If your board deck shows a coverage ratio but can’t show the conversion chain underneath, you have a screenshot, not a model.
What Does the B2B Funnel Velocity Calculator Actually Do?
The B2B Funnel Velocity Calculator forces all the assumptions into the open.
You put in your revenue goal. Your average selling price. Your time horizon. Your marketing budget. Then you work through the conversion chain: lead-to-MQL, MQL-to-SQL, SQL-to-opportunity, opportunity-to-close. You set your sales cycle length. You define what percentage of pipeline marketing owns versus sales development or inbound.
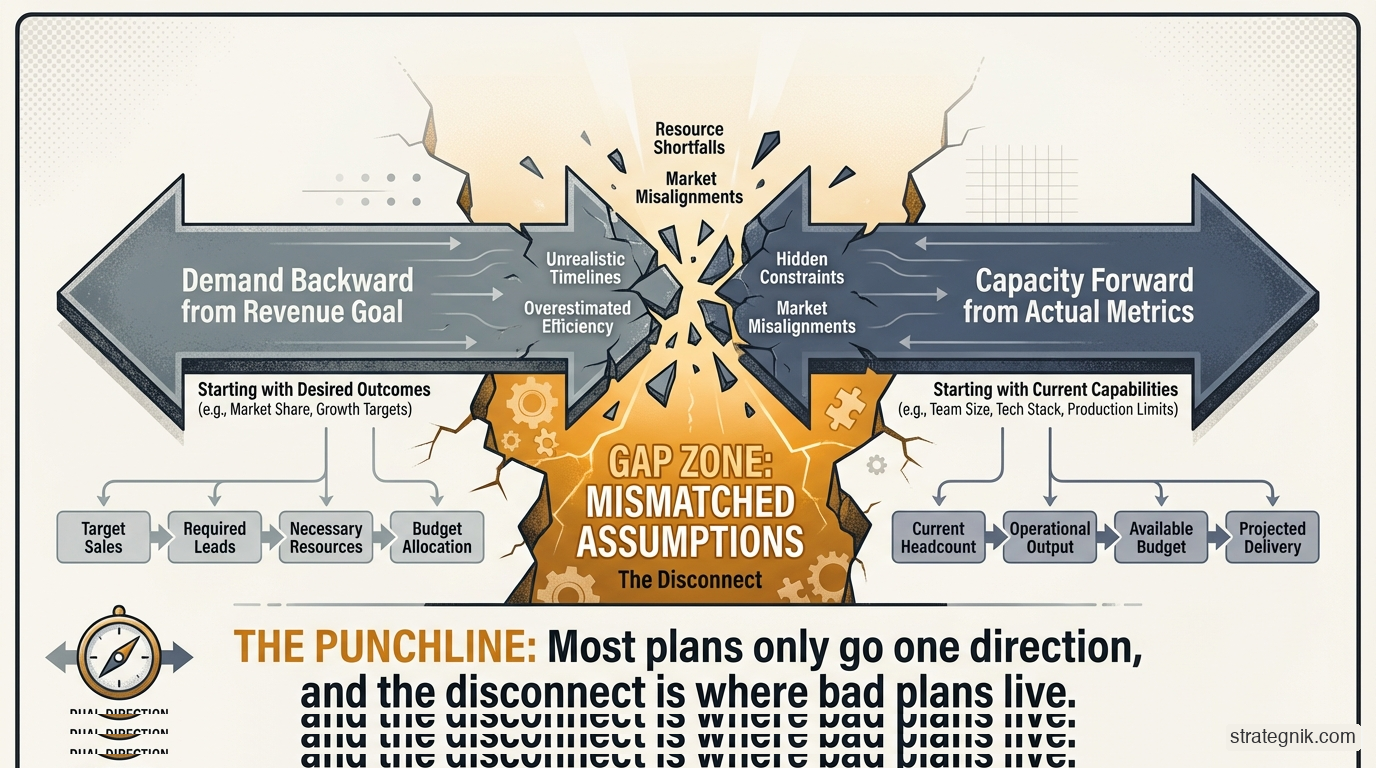
The model works both directions. You can start with the revenue goal and see what volume and conversion rates you need to hit it, what I call the demand-backward view. Or you can start with your actual funnel metrics and see what revenue they support, the capacity-forward view. Most planning processes only go one direction. The disconnect between the two is where bad plans live.
The calculator also surfaces unit economics: cost per lead, cost per SQL, cost per closed deal. Those numbers are guardrails, and they connect directly to stage-appropriate metrics that shift as your company matures. If your model requires a cost-per-SQL of $180 but your industry benchmarks are $600–$900, that’s not a budget problem to solve later. That’s a plan that doesn’t work, identifiable before you spend a dollar.
The last piece is what I call the Trigger Model. Given your sales cycle and your planning horizon, when do activities in Q1 actually show up as closed revenue? If your sales cycle is 90 days and you want deals closed by December 31, your pipeline generation window closes in early October. Every campaign you launch after that is working for next year’s number, not this year’s. Most revenue plans ignore this entirely: they assume a uniform pipeline contribution across all 12 months and then wonder why Q4 falls short.
How Does the Coherence Model™ Framework Explain Pipeline Failure?
In the Coherence Model™ framework I use to think about GTM systems, this is a problem of distance and velocity.
Distance is how far you are from your revenue goal. Velocity is the rate at which your funnel moves deals toward close. The uncomfortable truth is that most early-stage companies have no empirical read on their velocity. They’re estimating. And estimates compound: a 10% error in your close rate assumption, a 15% error in your cycle time, a 20% error in your SQL conversion. Stack those up and your model is off by half before you’ve run a single campaign. It’s the friction that kills deals before they start — compounding resistance that no amount of top-of-funnel volume can overcome.
Mass matters here too. A company with strong brand presence, a reference customer base, and an active content program generates pipeline at a different efficiency than a company with none of those things. Same budget, same tactics, different physics. The calculator lets you dial in a demand generation efficiency assumption, essentially a forcing function to ask: are we modeling this like a category leader or like a startup? Those aren’t the same equation.
The insight that made me build the tool is that most B2B revenue plans aren’t plans. They’re wishes with spreadsheets attached. The goal is set top-down, the budget is allocated, and somewhere in between, everyone agrees to believe the funnel will work out. The calculator breaks that agreement. It makes the mechanism visible. And once the mechanism is visible, the real conversation can start.
If this kind of systems thinking about GTM resonates, you might also find value in how I think about fractional CMO engagements and GTM architecture for growth-stage companies.
What Should You Model Instead of a Straight-Line Funnel?
The standard annual funnel model is a single row of point estimates multiplied together. That structure guarantees false confidence, because multiplication compounds every optimistic guess and hides which guess did the damage. Four upgrades fix most of it.
Model ranges, not points. Instead of “close rate: 20%,” model 15–25% and look at what the plan produces at both ends. If the revenue target only survives at the top of every range, you don’t have a plan with risk; you have a best case labeled as a plan.
Model both directions. Demand-backward tells you what the target requires. Capacity-forward tells you what your actual funnel can produce. The distance between those two numbers is the real planning gap, and it should be the first slide, not a footnote.
Model time, not just volume. A 90-day cycle means your effective pipeline year is nine months long, and your Q1 pipeline was built last year. Lay the conversion chain onto a calendar before committing to a quarterly bookings shape. Uniform monthly pipeline contribution is the single most common silent assumption in revenue plans, and it is almost never true.
Model marketing’s actual share. Marketing rarely sources all pipeline. Set the sourced-pipeline split explicitly, then check it against what your CRM says happened last year. If the model needs marketing at 60% and history says 35%, the gap is a strategy question, not a spreadsheet cell.
None of this requires better data than you have today. It requires stating the assumptions you’re already making. The calculator exists so that takes fifteen minutes instead of a weekend in a spreadsheet.
What Should Founders, CROs, and Marketing Leaders Do With This?
If you’re a founder or CRO: Run your current revenue plan through the calculator before your next board meeting. Not to validate it — to pressure-test it. Specifically: what does your model assume about your close rate? Your SQL volume? Your marketing-sourced percentage? If those assumptions have never been stated explicitly, they’ve never been defended. The board will ask eventually. Better to find the gaps now.
If you’re a marketing leader: Use the demand-backward view to reframe budget conversations. Instead of asking for more budget in the abstract, show what your current budget can produce in terms of closed revenue, and what additional budget would buy in incremental pipeline. That’s a capital allocation argument, not a marketing argument. It lands differently.
In both cases: Pay attention to the unit economics output. If the model requires a cost-per-closed-deal that’s lower than what your industry typically supports, you have three options: increase budget, increase conversion rates, or reduce the revenue target. Those are the only levers. The calculator makes that choice explicit rather than invisible.
The tool is free. The math has always been there. Most plans just haven’t been willing to look at it.
Frequently Asked Questions
How do I calculate pipeline coverage? Divide your revenue target by your win rate on qualified pipeline. A $3M target at a 20% win rate requires $15M in qualified pipeline, which is 5x coverage. Two caveats: the win rate must be empirical, not aspirational, and the pipeline must be able to close within the planning period given your sales cycle. Stale or late-created pipeline inflates the ratio without improving the forecast.
Why doesn’t our funnel model predict revenue? Usually because it multiplies point estimates that were never validated individually. Small errors compound: a modest miss on close rate, cycle time, and SQL conversion together can put the model off by half. The fix is not a better multiplier but ranges on each assumption, a capacity-forward check against actual funnel history, and a timing model that accounts for your sales cycle.
How accurate is a funnel velocity model for early-stage companies? It’s as accurate as your inputs. For a company with 12+ months of funnel data, the model is highly predictive. For a pre-revenue startup estimating conversion rates, it’s a scenario-planning tool, useful for bracketing outcomes and identifying which assumptions matter most, not for producing a single “right” number. The value isn’t precision; it’s making the assumptions explicit.
What conversion rates should a Series A B2B SaaS company use as benchmarks? Industry averages for B2B SaaS: lead-to-MQL conversion around 15–25%, MQL-to-SQL around 30–40%, SQL-to-opportunity around 40–60%, and opportunity-to-close around 15–25%. Your mileage will vary by deal size, sales cycle, and market maturity. Use these as starting points, then replace with your actual data as you collect it. I maintain a fuller set of ranges in the B2B GTM metrics benchmark.
How does sales cycle length affect pipeline planning? Dramatically. A 90-day sales cycle means any pipeline generated in Q4 won’t close until Q1 of the following year. Most annual revenue plans ignore this: they assume pipeline contribution is uniform across all 12 months. The Trigger Model in the calculator makes this time lag visible so you can plan pipeline generation windows accurately.
Should marketing own 100% of pipeline generation? No. In most B2B SaaS companies, marketing sources 40–60% of pipeline, with the remainder coming from sales development, partnerships, and inbound referral. The calculator lets you set this ratio explicitly. If your model assumes marketing sources 80% of pipeline but your SDR team generates half your SQLs, the model is wrong before you start.
What’s the most common mistake founders make in revenue planning? Setting the revenue target and the marketing budget independently, without reconciling the funnel math between them. A $5M ARR target with a $200K marketing budget isn’t ambitious — it’s impossible in most B2B contexts. The calculator makes this gap visible in under five minutes. Better to know now than to discover it in Q3.